Reports
Execution log
The nextflow log command shows information about executed pipelines in the current folder:
nextflow log <run name> [options]
Note
Both the execution report and the trace file must be specified when the pipeline is first called. By contrast, the log option is useful after a pipeline has already run and is available for every executed pipeline.
By default, log prints the list of executed pipelines:
$ nextflow log
TIMESTAMP            RUN NAME         SESSION ID                            COMMAND
2016-08-01 11:44:51  grave_poincare   18cbe2d3-d1b7-4030-8df4-ae6c42abaa9c  nextflow run hello
2016-08-01 11:44:55  small_goldstine  18cbe2d3-d1b7-4030-8df4-ae6c42abaa9c  nextflow run hello -resume
2016-08-01 11:45:09  goofy_kilby      0a1f1589-bd0e-4cfc-b688-34a03810735e  nextflow run rnatoy -with-docker
Specifying a run name or session id prints tasks executed by that pipeline run:
$ nextflow log goofy_kilby
/Users/../work/0b/be0d1c4b6fd6c778d509caa3565b64
/Users/../work/ec/3100e79e21c28a12ec2204304c1081
/Users/../work/7d/eb4d4471d04cec3c69523aab599fd4
/Users/../work/8f/d5a26b17b40374d37338ccfe967a30
/Users/../work/94/dfdfb63d5816c9c65889ae34511b32
Customizing fields
By default, only the task execution paths are printed. A custom list of fields to print can be provided via the -f (-fields) option. For example:
$ nextflow log goofy_kilby -f hash,name,exit,status
0b/be0d1c  buildIndex (ggal_1_48850000_49020000.Ggal71.500bpflank)  0  COMPLETED
ec/3100e7  mapping (ggal_gut)                                       0  COMPLETED
7d/eb4d44  mapping (ggal_liver)                                     0  COMPLETED
8f/d5a26b  makeTranscript (ggal_liver)                              0  COMPLETED
94/dfdfb6  makeTranscript (ggal_gut)                                0  COMPLETED
The fields accepted by the -f options are the ones in the trace report, as well as: script, stdout, stderr, env. List available fields using the -l (-list-fields) option.
The script field is useful for examining script commands run in each task:
$ nextflow log goofy_kilby -f name,status,script
align_genome      COMPLETED
   bowtie --index /data/genome input.fastq > output
...
Templates
The -t option allows a template (string or file) to be specified. This makes it possible to create complex custom reports in any text-based format. For example, you could save this Markdown snippet to a file:
## $name

script:

    $script

exit status: $exit
task status: $status
task folder: $folder
Then, the following command will output a markdown file containing the script, exit status and folder of all executed tasks:
nextflow log goofy_kilby -t my-template.md > execution-report.md
Filtering
The filter option makes it possible to select which entries to include in the log report. Any valid groovy boolean expression on the log fields can be used to define the filter condition. For example:
nextflow log goofy_kilby -filter 'name =~ /hello.*/ && status == "FAILED"'
Execution report
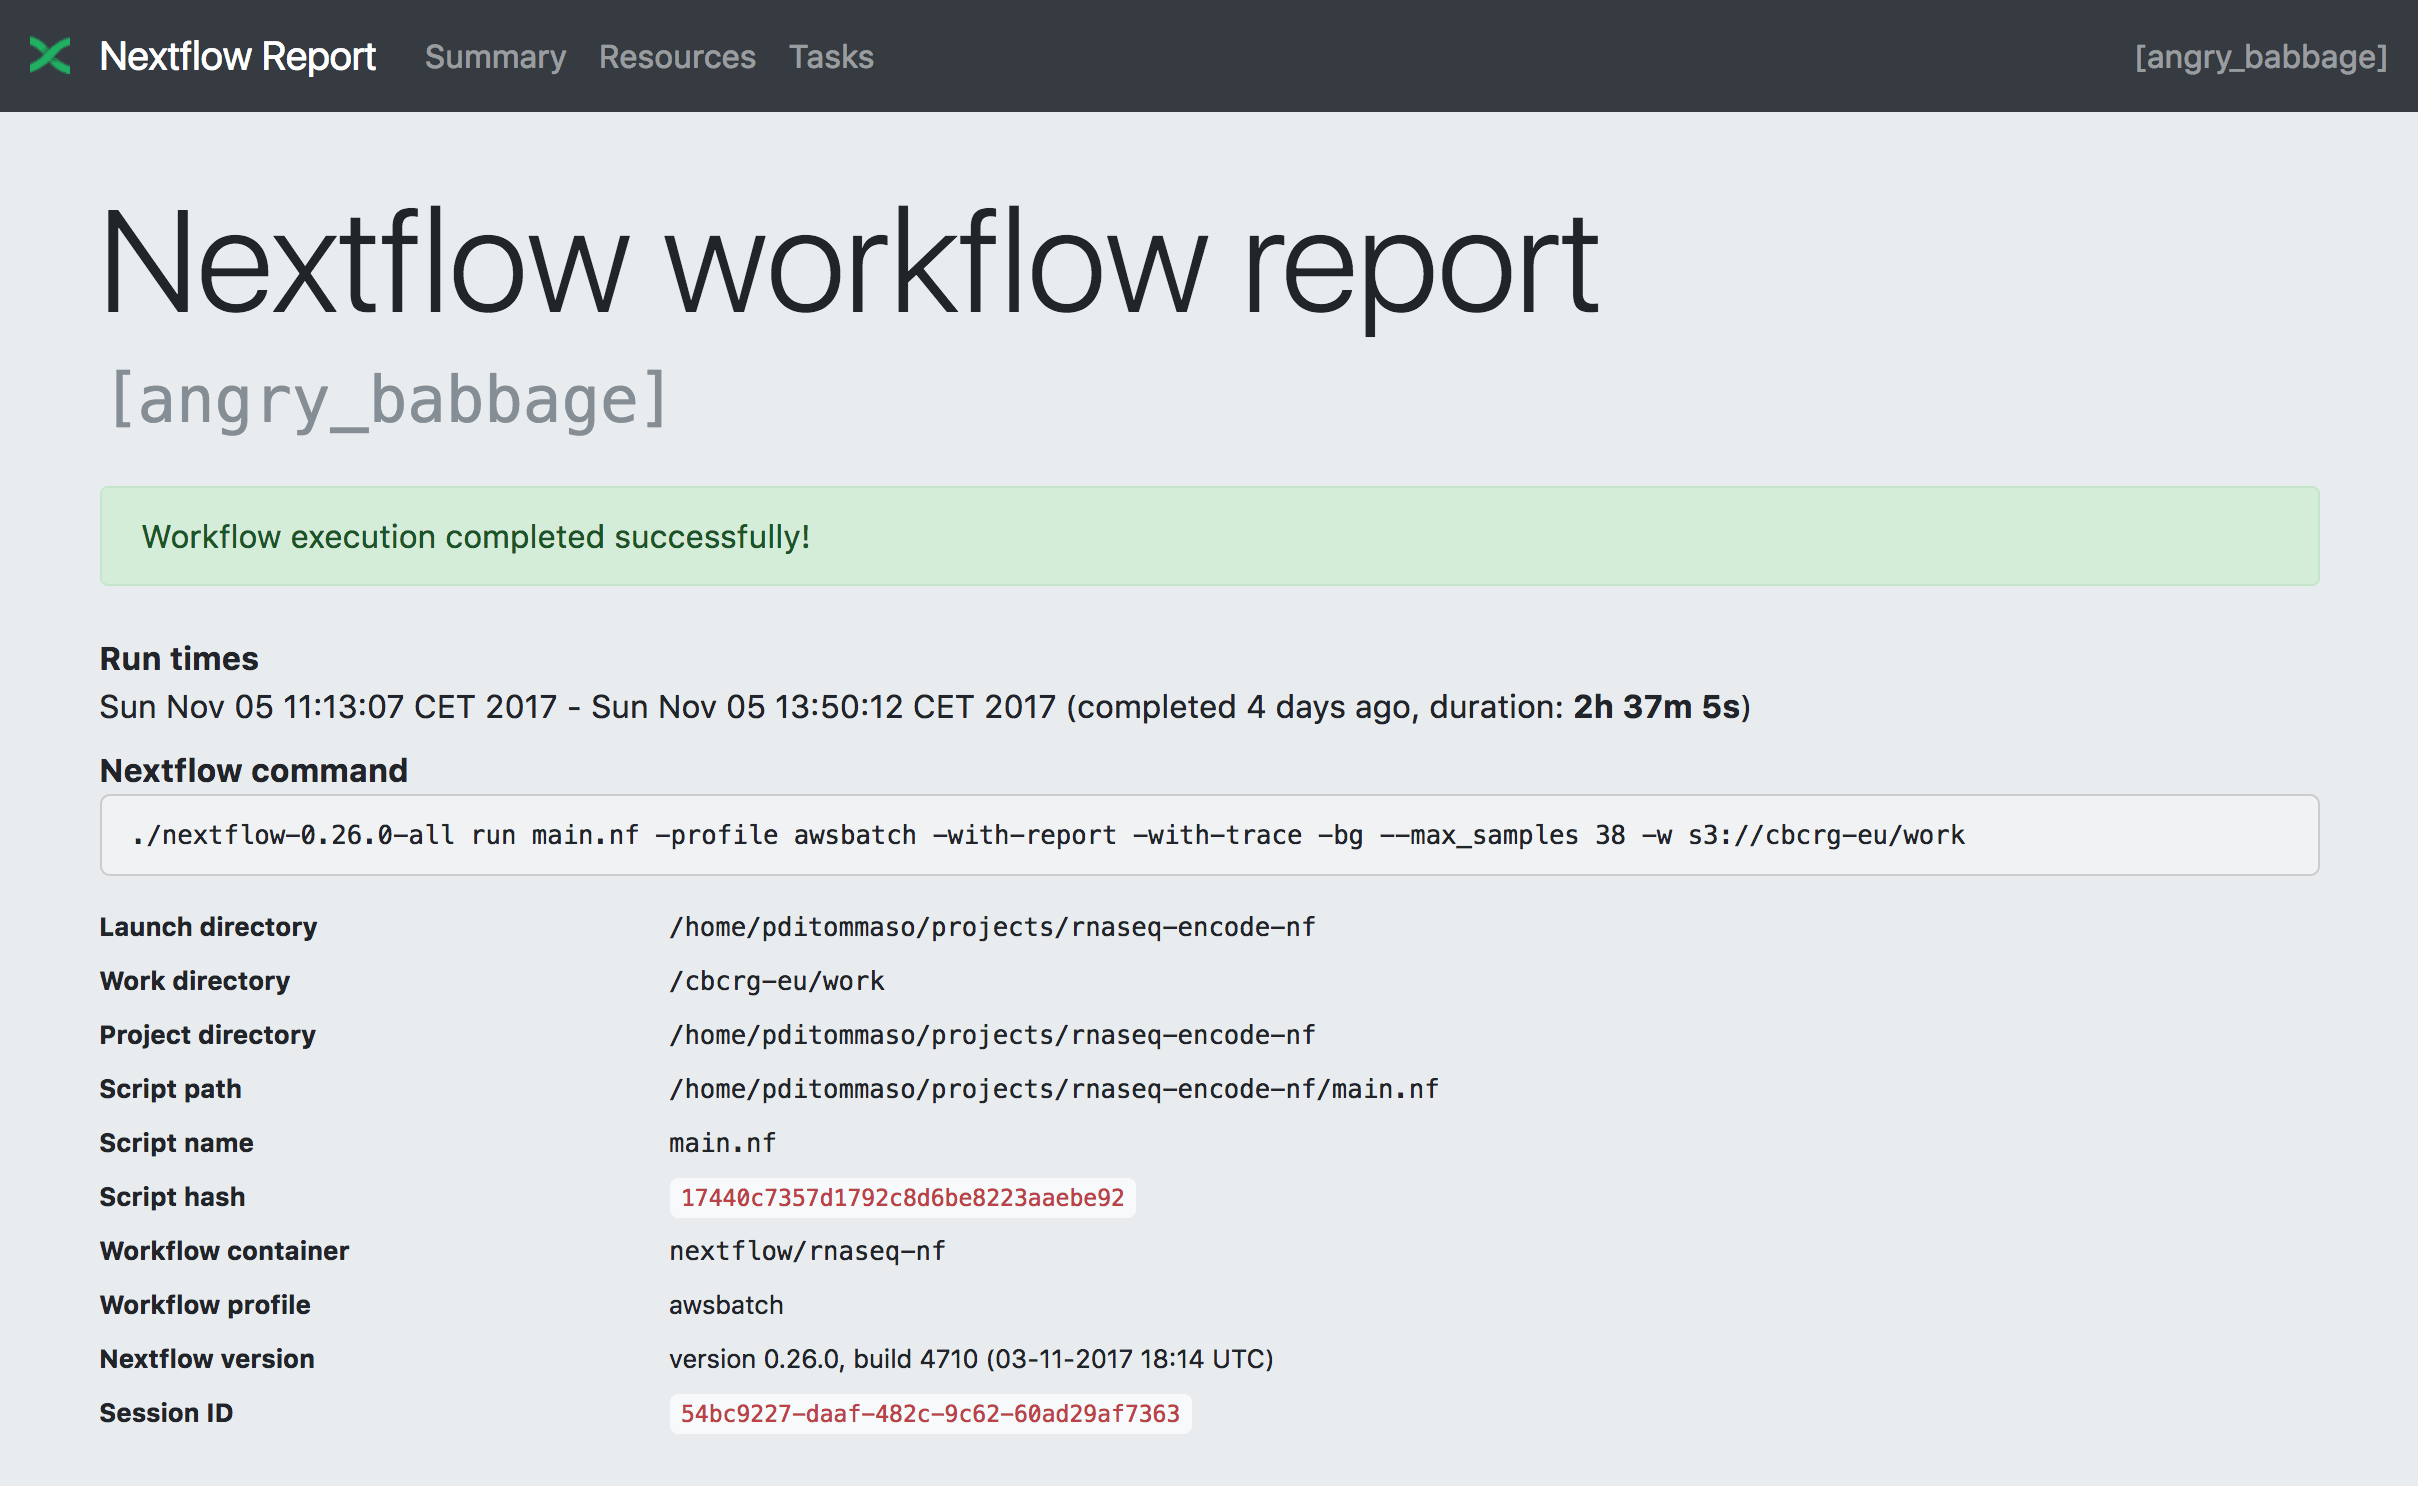
Nextflow can create an HTML execution report: a single document which includes many useful metrics about a workflow execution. The report is organised in the three main sections: Summary, Resources and Tasks (see below for details).
To enable the creation of this report add the -with-report command line option when launching the pipeline execution. For example:
nextflow run <pipeline> -with-report [file name]
The report file name can be specified as an optional parameter following the report option.
Summary
The Summary section reports the execution status, the launch command, overall execution time and some other workflow metadata. You can see an example below:

Resource Usage
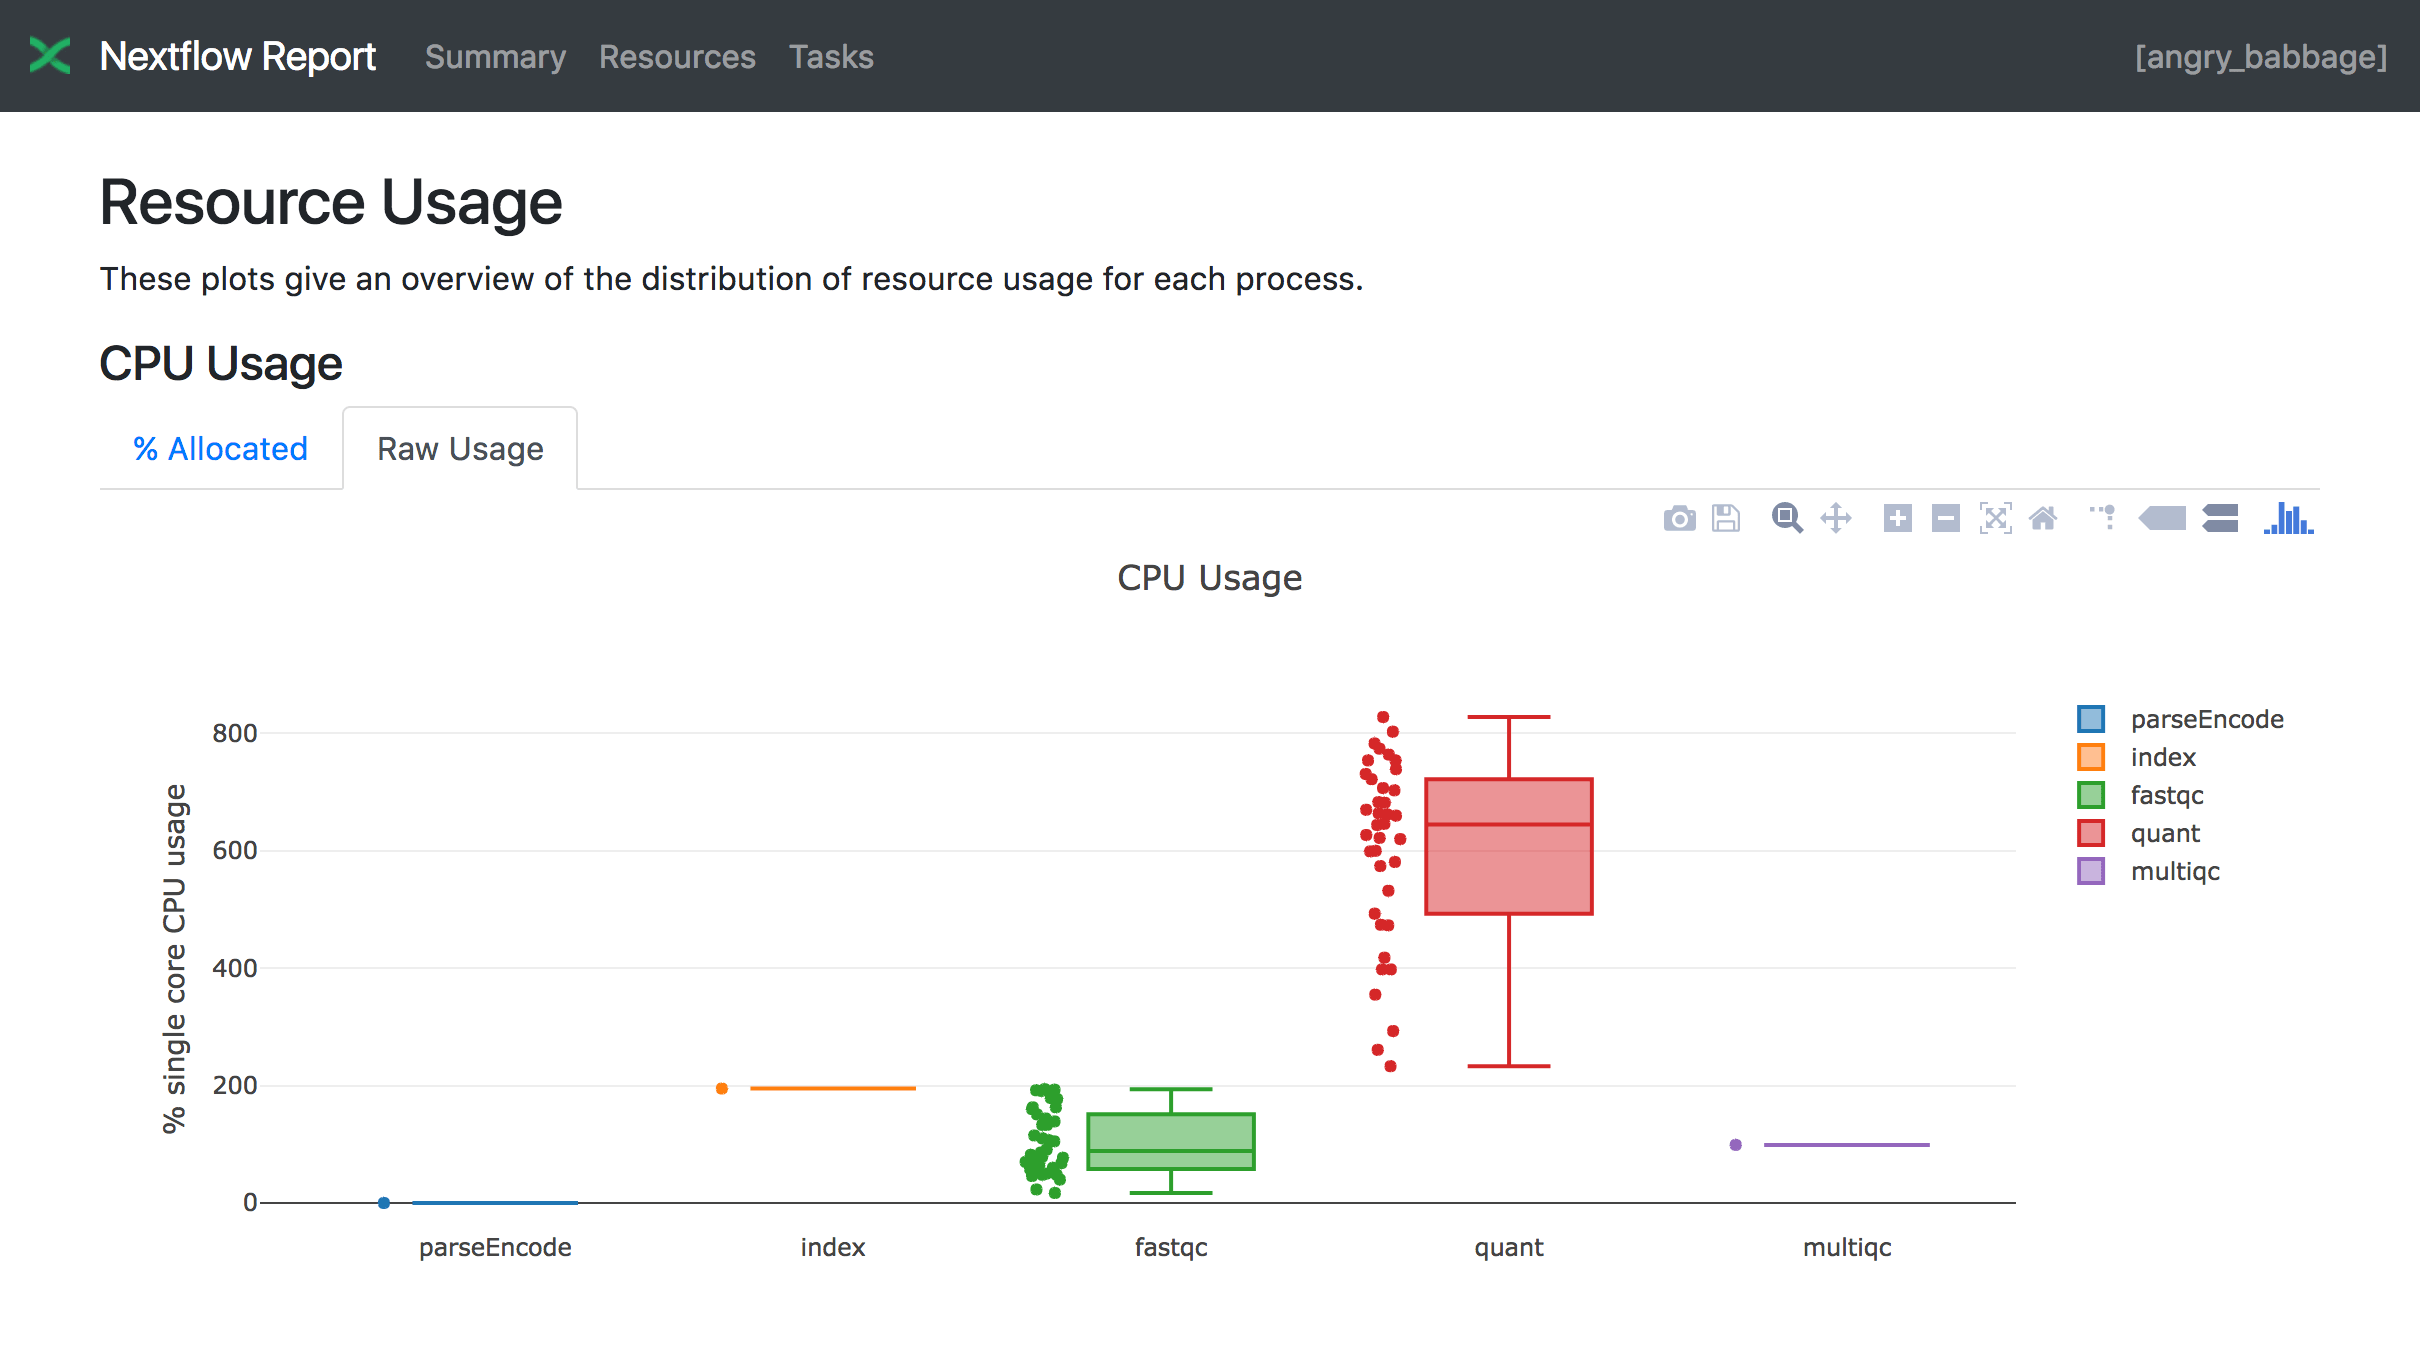
The Resources section plots the distribution of resource usage for each workflow process using the interactive plotly.js plotting library.
Plots are shown for CPU, memory, job duration and disk I/O. They have two (or three) tabs with the raw values and a percentage representation showing what proportion of the requested resources were used. These plots are very helpful to check that task resources are used efficiently.

Learn more about how resource usage is computed in this tutorial.
Tasks
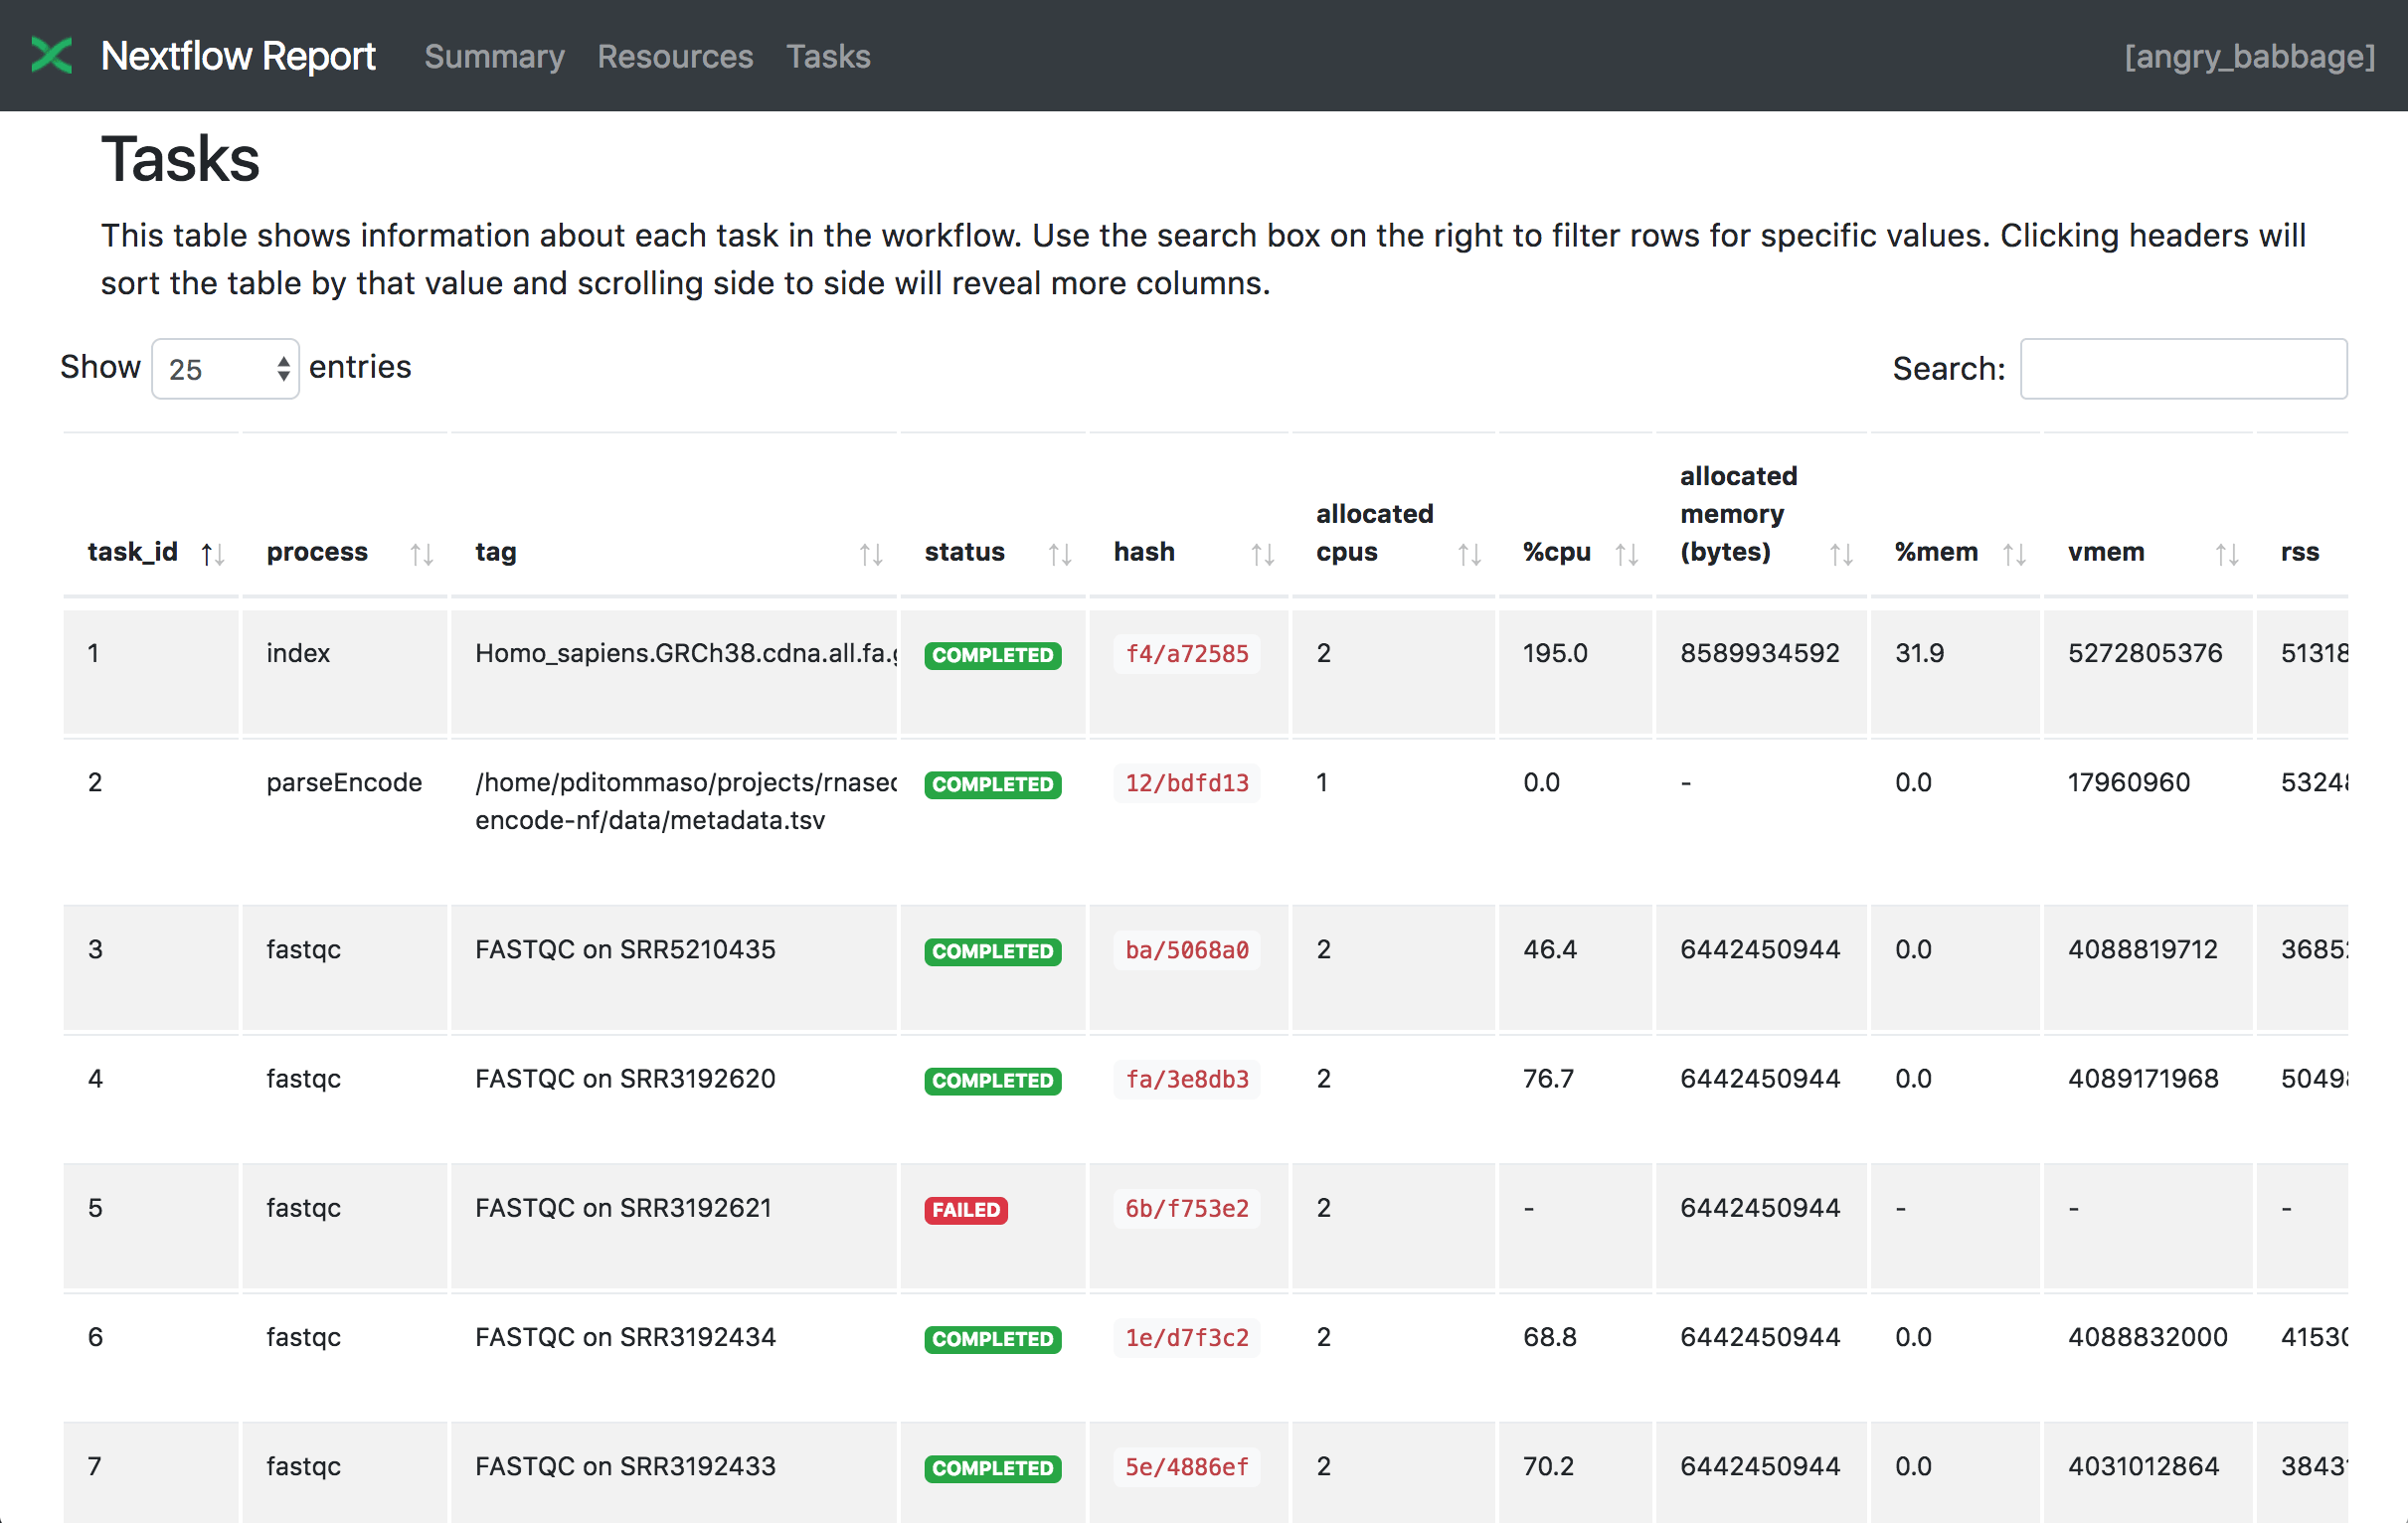
The Tasks section lists all executed tasks, reporting for each of them the status, the actual command script, and many other metrics. You can see an example below:

Note
Nextflow collects these metrics through a background process for each job in the target environment. Make sure the following tools are available in the environment where tasks are executed: awk, date, grep, ps, sed, tail, tee. Moreover, some of these metrics are not reported when running on Mac OS X. See the corresponding note in the trace file section.
Warning
A common problem when using a third party container image is that it does not include one or more of the above utilities, resulting in an empty execution report.
Please read Report scope section to learn more about the execution report configuration details.
Trace file
Nextflow creates an execution tracing file that contains some useful information about each process executed in your pipeline script, including: submission time, start time, completion time, cpu and memory used.
In order to create the execution trace file add the -with-trace command line option when launching the pipeline execution. For example:
nextflow run <pipeline> -with-trace
It will create a file named trace.txt in the current directory. The content looks like the above example:
task_id |
hash |
native_id |
name |
status |
exit |
submit |
duration |
walltime |
%cpu |
rss |
vmem |
rchar |
wchar |
|---|---|---|---|---|---|---|---|---|---|---|---|---|---|
19 |
45/ab752a |
2032 |
blast (1) |
COMPLETED |
0 |
2014-10-23 16:33:16.288 |
1m |
5s |
0.0% |
29.8 MB |
354 MB |
33.3 MB |
0 |
20 |
72/db873d |
2033 |
blast (2) |
COMPLETED |
0 |
2014-10-23 16:34:17.211 |
30s |
10s |
35.7% |
152.8 MB |
428.1 MB |
192.7 MB |
1 MB |
21 |
53/d13188 |
2034 |
blast (3) |
COMPLETED |
0 |
2014-10-23 16:34:17.518 |
29s |
20s |
4.5% |
289.5 MB |
381.6 MB |
33.3 MB |
0 |
22 |
26/f65116 |
2035 |
blast (4) |
COMPLETED |
0 |
2014-10-23 16:34:18.459 |
30s |
9s |
6.0% |
122.8 MB |
353.4 MB |
33.3 MB |
0 |
23 |
88/bc00e4 |
2036 |
blast (5) |
COMPLETED |
0 |
2014-10-23 16:34:18.507 |
30s |
19s |
5.0% |
195 MB |
395.8 MB |
65.3 MB |
121 KB |
24 |
74/2556e9 |
2037 |
blast (6) |
COMPLETED |
0 |
2014-10-23 16:34:18.553 |
30s |
12s |
43.6% |
140.7 MB |
432.2 MB |
192.7 MB |
182.7 MB |
28 |
b4/0f9613 |
2041 |
exonerate (1) |
COMPLETED |
0 |
2014-10-23 16:38:19.657 |
1m 30s |
1m 11s |
94.3% |
611.6 MB |
693.8 MB |
961.2 GB |
6.1 GB |
32 |
af/7f2f57 |
2044 |
exonerate (4) |
COMPLETED |
0 |
2014-10-23 16:46:50.902 |
1m 1s |
38s |
36.6% |
115.8 MB |
167.8 MB |
364 GB |
5.1 GB |
33 |
37/ab1fcc |
2045 |
exonerate (5) |
COMPLETED |
0 |
2014-10-23 16:47:51.625 |
30s |
12s |
59.6% |
696 MB |
734.6 MB |
354.3 GB |
420.4 MB |
31 |
d7/eabe51 |
2042 |
exonerate (3) |
COMPLETED |
0 |
2014-10-23 16:45:50.846 |
3m 1s |
2m 6s |
130.1% |
703.3 MB |
760.9 MB |
1.1 TB |
28.6 GB |
36 |
c4/d6cc15 |
2048 |
exonerate (6) |
COMPLETED |
0 |
2014-10-23 16:48:48.718 |
3m 1s |
2m 43s |
116.6% |
682.1 MB |
743.6 MB |
868.5 GB |
42 GB |
30 |
4f/1ad1f0 |
2043 |
exonerate (2) |
COMPLETED |
0 |
2014-10-23 16:45:50.961 |
10m 2s |
9m 16s |
95.5% |
706.2 MB |
764 MB |
1.6 TB |
172.4 GB |
52 |
72/41d0c6 |
2055 |
similarity (1) |
COMPLETED |
0 |
2014-10-23 17:13:23.543 |
30s |
352ms |
0.0% |
35.6 MB |
58.3 MB |
199.3 MB |
7.9 MB |
57 |
9b/111b5e |
2058 |
similarity (6) |
COMPLETED |
0 |
2014-10-23 17:13:23.655 |
30s |
488ms |
0.0% |
108.2 MB |
158 MB |
317.1 MB |
9.8 MB |
53 |
3e/bca30f |
2061 |
similarity (2) |
COMPLETED |
0 |
2014-10-23 17:13:23.770 |
30s |
238ms |
0.0% |
6.7 MB |
29.6 MB |
190 MB |
91.2 MB |
54 |
8b/d45b47 |
2062 |
similarity (3) |
COMPLETED |
0 |
2014-10-23 17:13:23.808 |
30s |
442ms |
0.0% |
108.1 MB |
158 MB |
832 MB |
565.6 MB |
55 |
51/ac19c6 |
2064 |
similarity (4) |
COMPLETED |
0 |
2014-10-23 17:13:23.873 |
30s |
6s |
0.0% |
112.7 MB |
162.8 MB |
4.9 GB |
3.9 GB |
56 |
c3/ec5f4a |
2066 |
similarity (5) |
COMPLETED |
0 |
2014-10-23 17:13:23.948 |
30s |
616ms |
0.0% |
10.4 MB |
34.6 MB |
238 MB |
8.4 MB |
98 |
de/d6c0a6 |
2099 |
matrix (1) |
COMPLETED |
0 |
2014-10-23 17:14:27.139 |
30s |
1s |
0.0% |
4.8 MB |
42 MB |
240.6 MB |
79 KB |
Trace fields
The following table shows the fields that can be included in the execution report:
task_idTask ID.
hashTask hash code.
native_idTask ID given by the underlying execution system e.g. POSIX process PID when executed locally, job ID when executed by a grid engine, etc.
processNextflow process name.
tagUser provided identifier associated this task.
nameTask name.
statusTask status. Possible values are:
NEW,SUBMITTED,RUNNING,COMPLETED,FAILED, andABORTED.exitPOSIX process exit status.
moduleEnvironment module used to run the task.
containerDocker image name used to execute the task.
cpusThe cpus number request for the task execution.
timeThe time request for the task execution
diskThe disk space request for the task execution.
memoryThe memory request for the task execution.
attemptAttempt at which the task completed.
submitTimestamp when the task has been submitted.
startTimestamp when the task execution has started.
completeTimestamp when task execution has completed.
durationTime elapsed to complete since the submission.
realtimeTask execution time i.e. delta between completion and start timestamp.
queueThe queue that the executor attempted to run the process on.
%cpuPercentage of CPU used by the process.
%memPercentage of memory used by the process.
rssReal memory (resident set) size of the process. Equivalent to
ps -o rss.vmemVirtual memory size of the process. Equivalent to
ps -o vsize.peak_rssPeak of real memory. This data is read from field
VmHWMin/proc/$pid/statusfile.peak_vmemPeak of virtual memory. This data is read from field
VmPeakin/proc/$pid/statusfile.rcharNumber of bytes the process read, using any read-like system call from files, pipes, tty, etc. This data is read from file
/proc/$pid/io.wcharNumber of bytes the process wrote, using any write-like system call. This data is read from file
/proc/$pid/io.syscrNumber of read-like system call invocations that the process performed. This data is read from file
/proc/$pid/io.syscwNumber of write-like system call invocations that the process performed. This data is read from file
/proc/$pid/io.read_bytesNumber of bytes the process directly read from disk. This data is read from file
/proc/$pid/io.write_bytesNumber of bytes the process originally dirtied in the page-cache (assuming they will go to disk later). This data is read from file
/proc/$pid/io.vol_ctxtNumber of voluntary context switches. This data is read from field
voluntary_ctxt_switchesin/proc/$pid/statusfile.inv_ctxtNumber of involuntary context switches. This data is read from field
nonvoluntary_ctxt_switchesin/proc/$pid/statusfile.envThe variables defined in task execution environment.
workdirThe directory path where the task was executed.
scriptThe task command script.
scratchThe value of the process
scratchdirective.error_actionThe action applied on error for task failure.
hostnameNew in version 22.05.0-edge.
The host on which the task was executed. Supported only for the Kubernetes executor yet. Activate with
k8s.fetchNodeName = truein the Nextflow config file.cpu_modelNew in version 22.07.0-edge.
The name of the CPU model used to execute the task. This data is read from file
/proc/cpuinfo.
Note
These metrics provide an estimation of the resources used by running tasks. They are not an alternative to low-level performance analysis tools, and they may not be completely accurate, especially for very short-lived tasks (running for less than a few seconds).
Trace report layout and other configuration settings can be specified by using the nextflow.config configuration file.
Please read Trace scope section to learn more about it.
Execution timeline
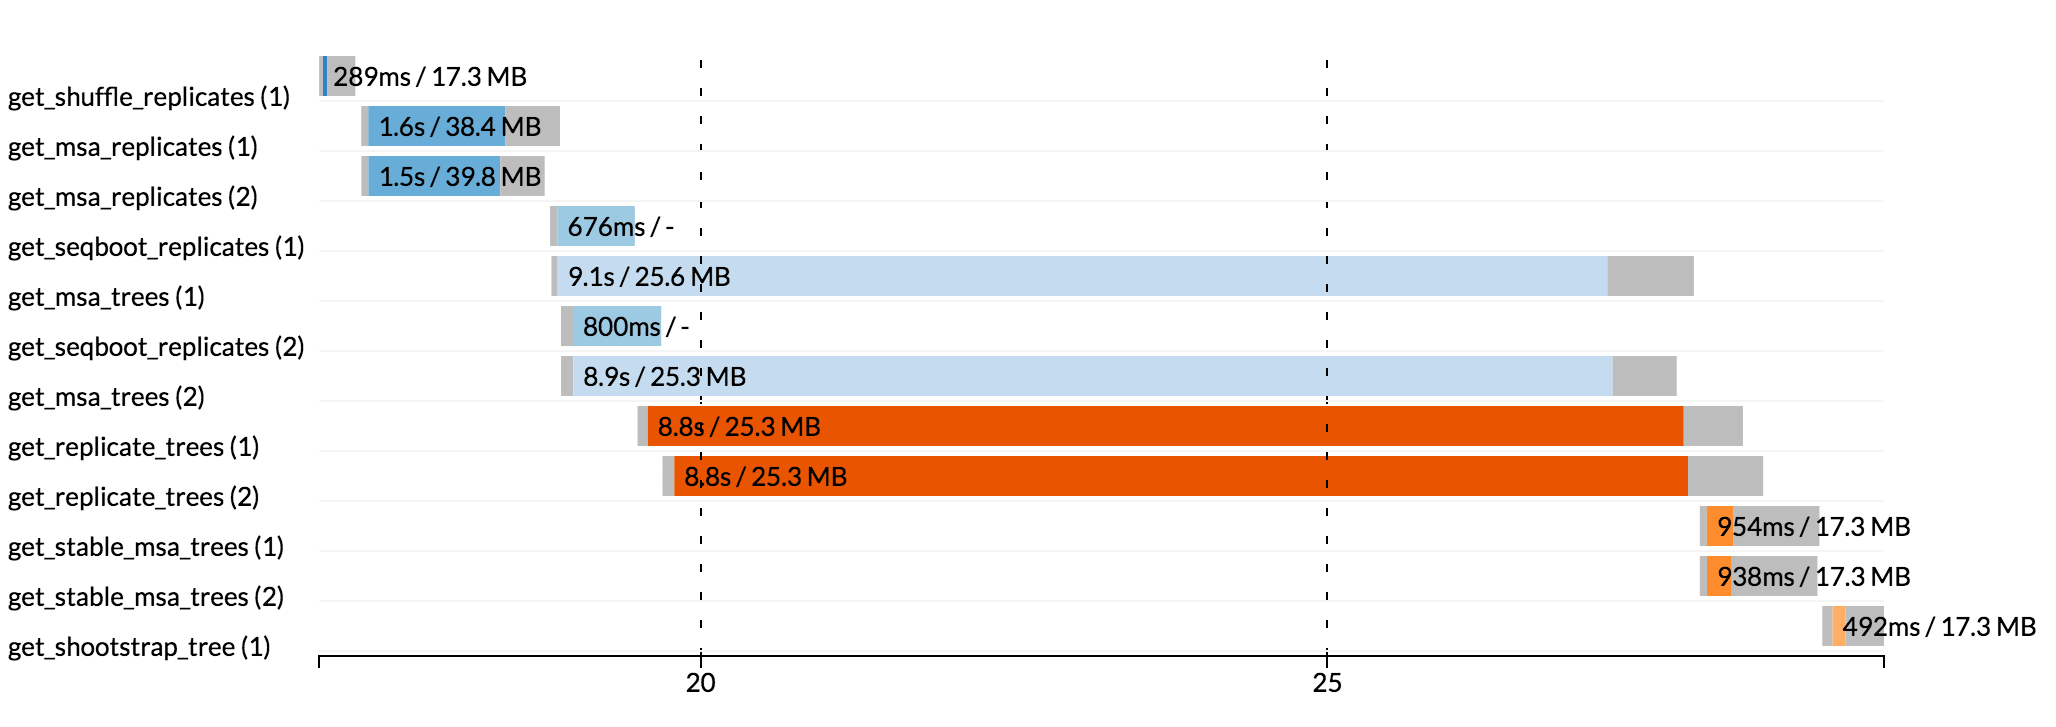
Nextflow can render an HTML timeline for all processes executed in your pipeline. An example of the execution timeline is shown below:

Each bar represents a process run in the pipeline execution. The bar length represents the task duration time (wall-time). The colored area in each bar represents the real execution time. The grey area to the left of the colored area represents the task scheduling wait time. The grey area to the right of the colored area represents the task termination time (clean-up and file un-staging). The numbers on the x-axis represent the time in absolute units e.g. minutes, hours, etc.
Each bar displays two numbers: the task duration time and the virtual memory size peak.
As each process can spawn many tasks, colors are used to identify those tasks belonging to the same process.
To enable the creation of the execution timeline add the -with-timeline command line option when launching the pipeline execution. For example:
nextflow run <pipeline> -with-timeline [file name]
The report file name can be specified as an optional parameter following the timeline option.
Workflow diagram
A Nextflow pipeline can be represented as a direct acyclic graph (DAG). The vertices in the graph represent the pipeline’s processes and operators, while the edges represent the data dependencies (i.e. channels) between them.
To render the workflow DAG, run your pipeline with the -with-dag option. By default, it creates a file named dag-<timestamp>.html with the workflow DAG rendered as a Mermaid diagram.
The workflow DAG can be rendered in a different format by specifying an output file name with a different extension based on the desired format. For example:
nextflow run <pipeline> -with-dag flowchart.png
New in version 22.06.0-edge: You can use the -preview option with -with-dag to render the workflow DAG without executing any tasks.
Changed in version 23.10.0: The default output format was changed from DOT to HTML.
The following file formats are supported:
dotGraphviz DOT file
gexfGraph Exchange XML file (Gephi)
htmlHTML file with Mermaid diagram
Changed in version 23.10.0: The HTML format was changed to render a Mermaid diagram instead of a Cytoscape diagram.
mmdNew in version 22.04.0.
Mermaid diagram
pdfRequires Graphviz to be installed
Graphviz PDF file
pngRequires Graphviz to be installed
Graphviz PNG file
svgRequires Graphviz to be installed
Graphviz SVG file
Here is the Mermaid diagram produced by Nextflow for the rnaseq-nf pipeline (using the Mermaid Live Editor with the default theme):
nextflow run rnaseq-nf -preview -with-dag