Understanding task resource metrics
This tutorial explains how resource usage metrics are computed from execution reports. See Execution report for more information about how to enable them.
CPU Usage
CPU Usage plots report how CPU resources are used by each process.
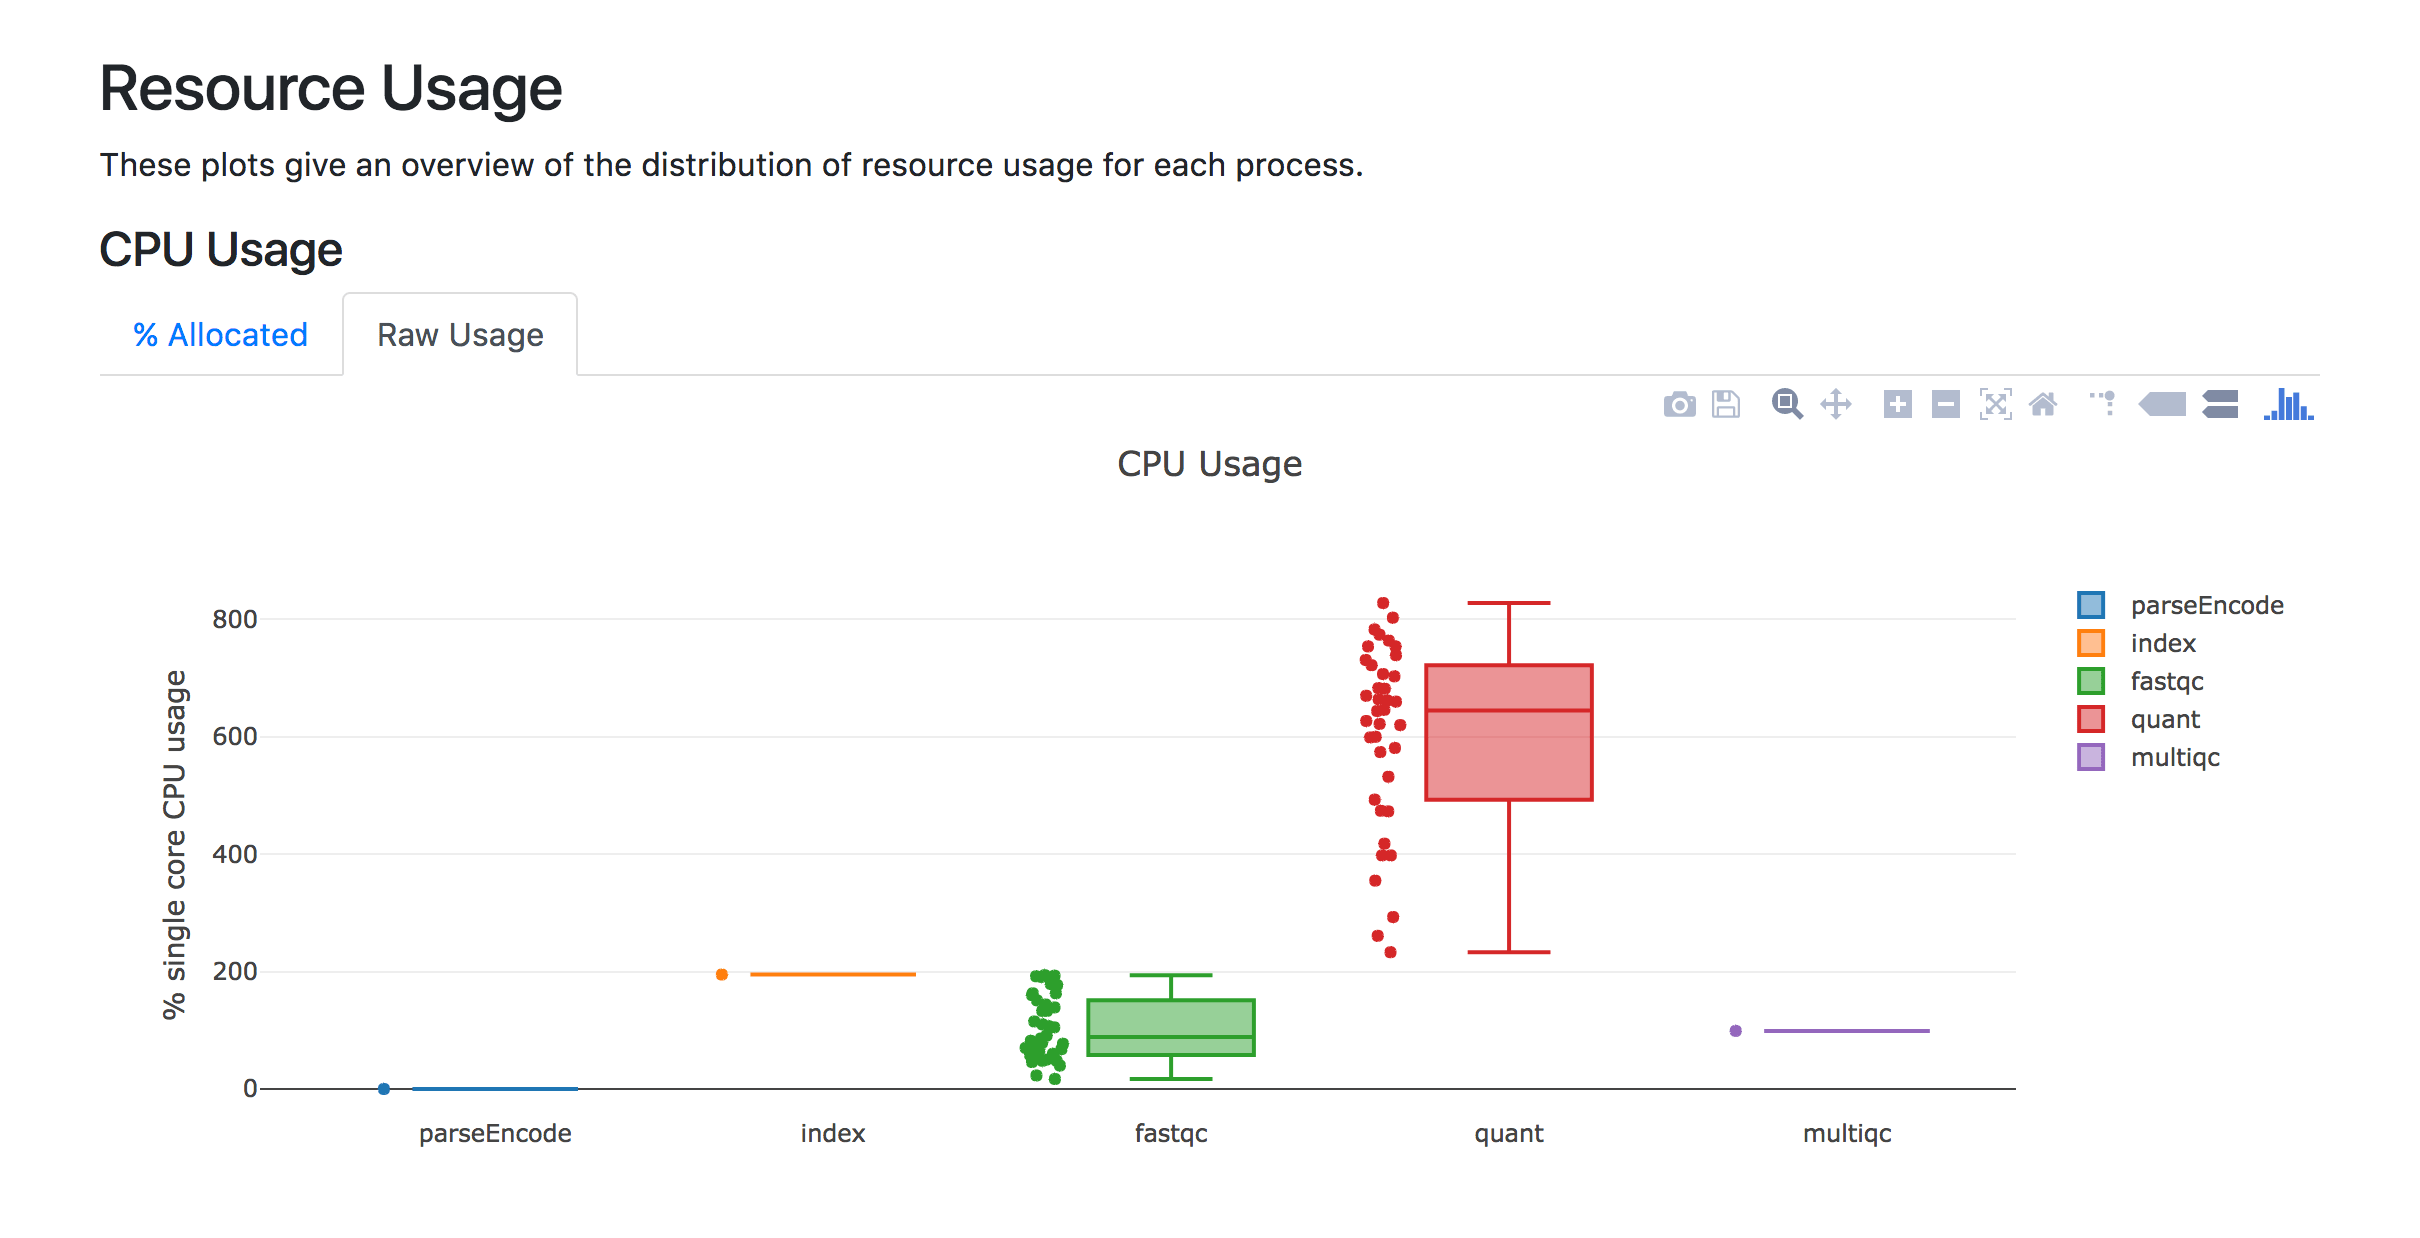
Raw Usage tabs are expected to show 100% core usage if processes perform one task of pure computation. If tasks are distributed over, 2, 3, or 4 CPUs, the raw usage will be 200%, 300%, or 400%, respectively. % Allocated tabs rescale raw usage values relative to the number of CPUs that are set with the cpus directive. If the cpus directive is not set, CPUs are set to 1 and % Allocated tabs will show the same values Raw Usage tabs.
For example, using the stress program, the following script would report 100% CPU usage in the Raw Usage tab and 50% CPU usage in the % Allocated tab as the process requested double the number of CPUs that are required:
process cpu_usage_ex1 {
  cpus 2

  script:
  """
  stress -c 1 -t 10 # compute square-root of random numbers during 10s using 1 CPU
  """
}

workflow{
    cpu_usage_ex1() // Stress using 1 CPU
}
Tip
See Linux stress command with examples for more information about the stress command.
CPU usage decreases if processes spend some time performing pure computation and some time waiting for CPUs. For example, using the stress and sleep commands, the following script would report 75% CPU usage in the Raw Usage tab:
process cpu_usage_ex2 {
  cpus 1

  script:
  """
  stress -c 1 -t 10 # compute square-root of random numbers during 10s using 1 CPU
  stress -c 1 -t 5 # compute square-root of random numbers during 5s using 1 CPU
  sleep 5 # use no CPU during 5s
  """
}

workflow{
    cpu_usage_ex2() // Stress using 1 CPU and sleep
}
In the above example, CPU usage is a weighted average that accounts for the percentage of the CPU used and duration of each individual program over the job duration:
CPU usage increases if a single step is forked on multiple CPUs:
process cpu_usage_ex3 {
  cpus 2

  script:
  """
  stress -c 2 -t 10 # compute square-root of random numbers during 10 s using 2 CPUs
  sleep 10 # use no CPU during 10s
  """
}

workflow{
    cpu_usage_ex3() // Stress using 2 CPUs and sleep
}
In the above example, the Raw Usage tab would report 100%:
However, the % Allocated tab would report 50%. It would not be relevant to change the cpus directive from 2 to 1 as the process uses 2 CPUs at it peak load.
Memory Usage
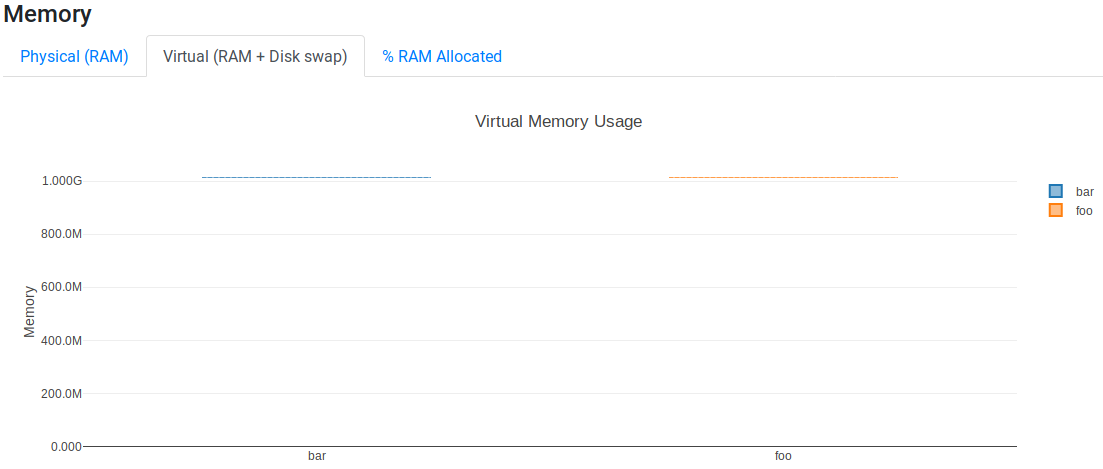
Memory Usage plots report how memory was used by each process. It has three tabs, Physical (RAM), Virtual (RAM + Disk swap), and % RAM Allocated, showing the usage of the physical memory (RAM), the virtual memory (vmem), and the percentage of RAM used by the process relative to the memory that the memory directive set, respectively.
Peak usage during process executions is reported for both physical and virtual memories. The total amount of memory used by a process is the virtual memory (vmem). The vmem contains all memory areas, including in the physical memory (RAM), in the swap space, on the disk, or shared with other processes. The resident set size (RSS) is the amount of physical memory (RAM) held by a process.
The relationship is:
The behavior of Memory Usage plots can be examined using two programs written in C. The first program allocates a variable of 1 GiB:
#include <stdio.h>
#include <stdlib.h>
#include <sys/resource.h>
#include <sys/time.h>
#include <sys/types.h>
#include <unistd.h>
#include <time.h>

/* Get vmem and rss usage from /proc/<pid>/statm */
static int mem_used(pid_t pid, unsigned long* vmem, unsigned long* rss) {
    FILE* file;
    char path[40];
    unsigned int page_size;

    snprintf(path, 40, "/proc/%ld/statm", (long) pid);
    file = fopen(path, "r");
    // vmem and rss are the first values in the file
    fscanf(file, "%lu %lu", vmem, rss);
    // values in statm are in pages so to get bytes we need to know page size
    page_size = (unsigned) getpagesize();
    *vmem = *vmem * page_size;
    *rss = *rss * page_size;

    fclose(file);
    return 0;
}

int main(int argc, char **argv) {
    unsigned char *address;
    char input;
    size_t size = 1024*1024*1024;  // 1 GiB
    unsigned long i;
    unsigned long vmem = 0;
    unsigned long rss = 0;
    pid_t pid;

    pid = getpid();
    printf("Pid: %ld\n", (long) pid);

    mem_used(pid, &vmem, &rss);
    printf("VMEM: %lu RSS: %lu\n", vmem, rss);

    address = malloc(size);
    printf("Allocated %d Bytes of memory\n", (int) size);

    mem_used(pid, &vmem, &rss);
    printf("VMEM: %lu RSS: %lu\n", vmem, rss);

    // Leave time for nextflow to get information
    sleep(15);

    free(address);
    return 0;
}
The second program allocates a variable of 1 GiB and fills it with data:
#include <stdio.h>
#include <stdlib.h>
#include <sys/resource.h>
#include <sys/time.h>
#include <sys/types.h>
#include <unistd.h>
#include <time.h>

/* Get vmem and rss usage from /proc/<pid>/statm */
static int mem_used(pid_t pid, unsigned long* vmem, unsigned long* rss) {
    FILE* file;
    char path[40];
    unsigned int page_size;

    snprintf(path, 40, "/proc/%ld/statm", (long) pid);
    file = fopen(path, "r");
    // vmem and rss are the first values in the file
    fscanf(file, "%lu %lu", vmem, rss);
    // values in statm are in pages so to get bytes we need to know page size
    page_size = (unsigned) getpagesize();
    *vmem = *vmem * page_size;
    *rss = *rss * page_size;

    fclose(file);
    return 0;
}

int main(int argc, char **argv) {
    unsigned char *address;
    char input;
    size_t size = 1024*1024*1024;  // 1 GiB
    unsigned long i;
    unsigned long vmem = 0;
    unsigned long rss = 0;
    pid_t pid;

    pid = getpid();
    printf("Pid: %ld\n", (long) pid);

    mem_used(pid, &vmem, &rss);
    printf("VMEM: %lu RSS: %lu\n", vmem, rss);

    address = malloc(size);
    printf("Allocated %d Bytes of memory\n", (int) size);

    mem_used(pid, &vmem, &rss);
    printf("VMEM: %lu RSS: %lu\n", vmem, rss);

    printf("Filling memory with data...");
    fflush(stdout);
    for (i = 0; i < size; i++) {
        *(address + i) = 123;
    }

    mem_used(pid, &vmem, &rss);
    printf("\nVMEM: %lu RSS: %lu\n", vmem, rss);

    // Leave time for nextflow to get information
    sleep(15);

    free(address);
    return 0;
}
The first and second programs are executed as malloc and malloc_fill, respectively, in the following script:
process malloc {
    memory '1.5 GB'

    script:
    """
    memory_vmem_1GiB_ram_0Gib
    """
}

process malloc_fill {
    memory '1.5 GB'

    script:
    """
    memory_vmem_1GiB_ram_1Gib
    """
}

workflow{
    malloc() // Allocates a variable of 1 GiB
    malloc_fill() // Allocates a variable of 1 GiB and fills it with data
}
The Virtual (RAM + Disk swap) tab shows that both malloc and malloc_fill use the same amount of virtual memory (~1 GiB):
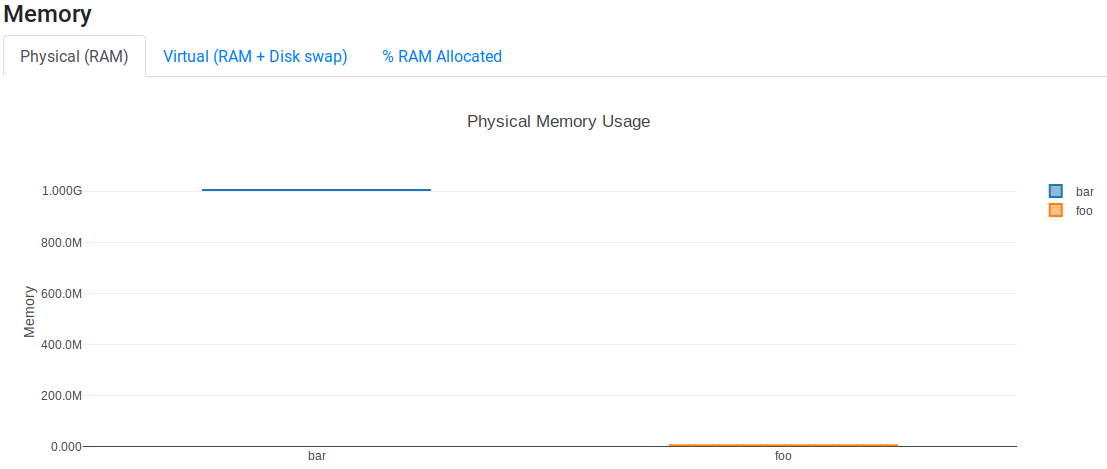
However, the Physical (RAM) tab shows that malloc_fill uses ~1 GiB of RAM while malloc uses ~0 GiB of RAM:
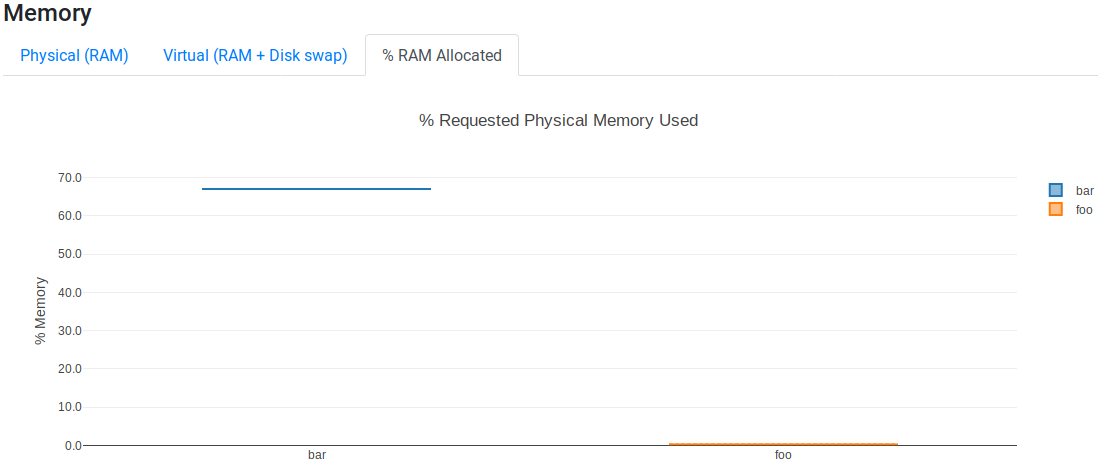
The % RAM Allocated tab shows that malloc and malloc_fill used 0% and 67% of resources set in the memory directive, respectively:
Warning
Memory and storage metrics are reported in bytes. For example, 1 KB = \(1024\) bytes, 1 MB = \(1024^2\) bytes, and 1 GB = \(1024^3\) bytes.
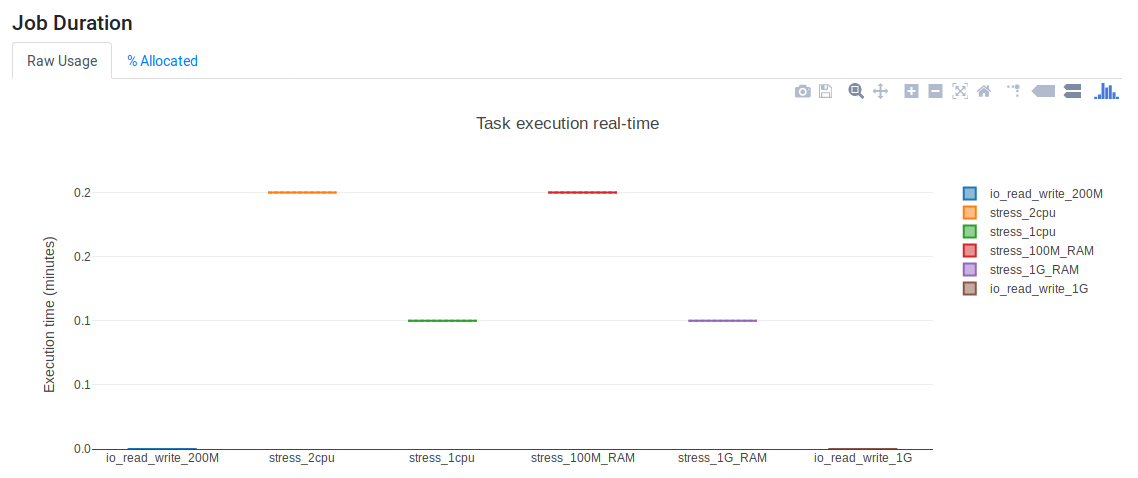
Job Duration
Job Duration plots report how long each process took to run. It has two tabs. The Raw Usage tab shows the job duration and the % Allocated tab shows the time that was requested relative to what was requested using the time directive. Job duration is sometimes known as elapsed real time, real time or wall time.
I/O Usage
I/O Usage plots show how much data was read and written by processes. The amount of data that was read by a process (rchar in trace files) is the number of bytes the process read using read-like system calls. The amount of data that was written by a process (wchar in trace files) is the number of bytes the process wrote using write-like system call. Read and write data is read from the file /proc/$pid/io.
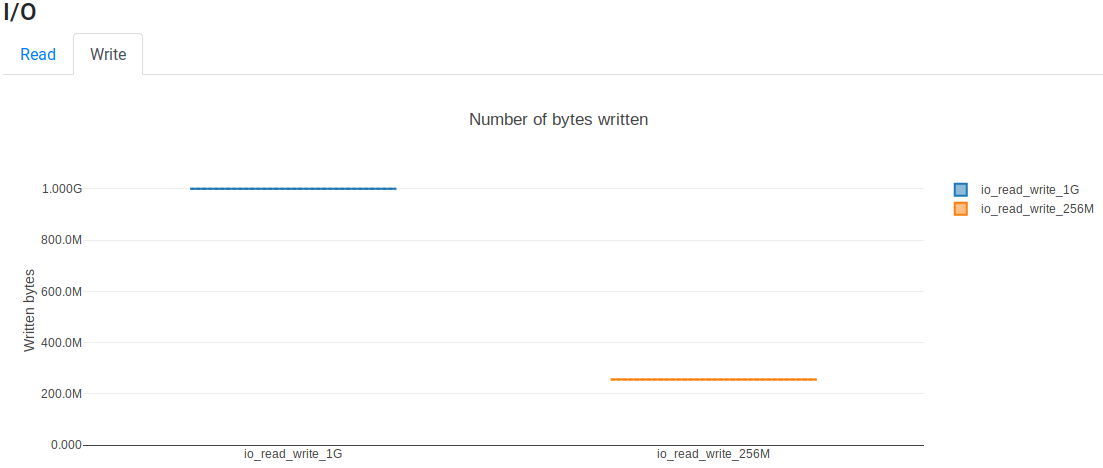
Read tabs shows how much data was read and Write tabs shows how much data was written by each process. For example, the following script reads and writes different data volumes:
process io_read_write_1G {
    script:
    """
    dd if=/dev/zero of=/dev/null bs=1G count=1
    """
}

process io_read_write_256M {
    script:
    """
    dd if=/dev/zero of=/dev/null bs=256M count=1
    """
}

workflow{
    io_read_write_1G()   // Read and write 1 GiB
    io_read_write_256M() // Read and write 256 Mb
}
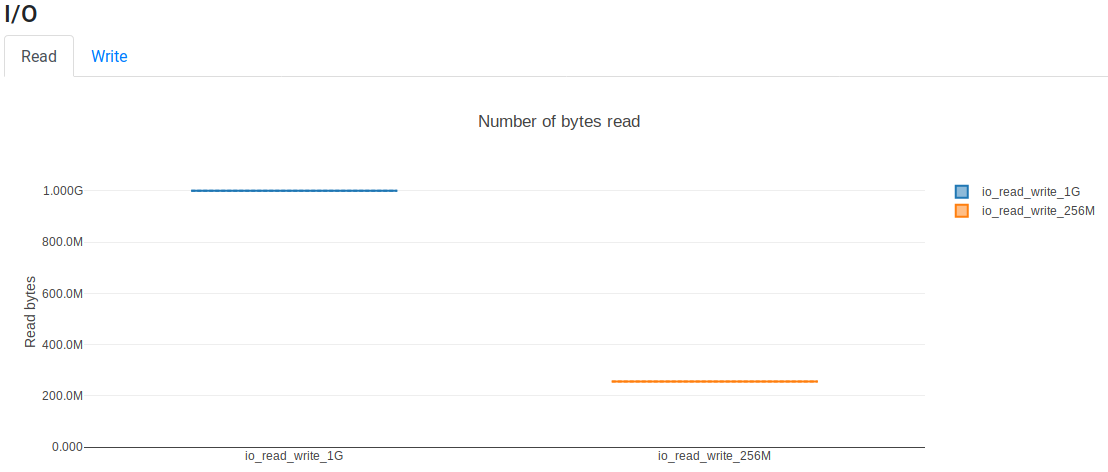
The Read tab shows that ~1 Gib and ~256 Mb are read:
The Write tab shows that ~1 Gib and ~256 Mb are written: